yt integration
O2sclpy uses yt to perform 3D volume renderings. A volume rendering
can be built upon a O2scl tensor_grid object using
yt-add-vol. A 3D scatter plot can be created from an O2scl table object using yt-scatter. A set of line segments can be
plotted using yt-vertex-list.
The volume renderings currently only work with the Agg backend, so if
any yt commands are found then the Agg backend is automatically chosen
by o2graph. Mixing 2D and 3D plots with o2graph is not well
documented or supported (even if they both use the Agg backend).
Internally the limits on the volume rendering are always \([0,1]\)
for all three axes. The variables xlo, xhi, ylo, yhi,
zlo, and zhi control the limits of the volume in the “user
coordinate system”. These can be set manually or if not, they are set
automatically by the first yt-related command. All commands work on
the user coordinate system by default, and then transform their
arguments to \([0,1]\) when necessary.
During animations, yt text objects will be reoriented to ensure they
are parallel to the camera and upright if the keyword argument
reorient=True is given.
Annotations to volume visualizations can be constructed from normal 2D o2graph plotting commands, and in this case the coordinate system for the 2D annotations is set to be \([0,1]\) in both width and height, so that the lower left corner of the image is \((0,0)\).
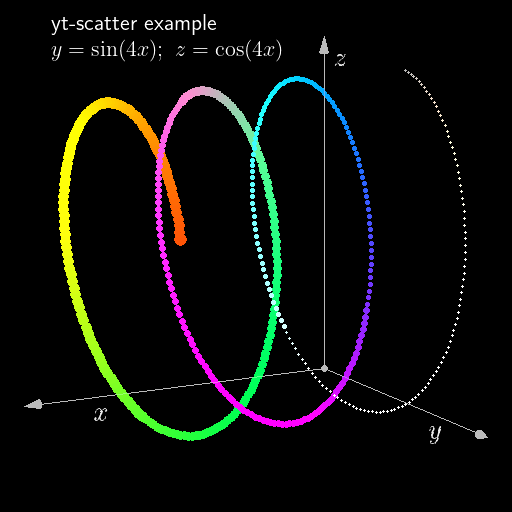
yt scatter example
# This example demonstrates the use of scatter to plot points in a 3D
# volume using yt. At the end, yt-source-list lists all of the yt
# objects in the scene, including the default volume, the point source
# for the scatter plot, the origin, the axis lines, the axis arrows,
# and the three axis titles.
#
o2graph -create table x "grid:0,5,0.01" \
        -function "sin(4*x)" y -function "cos(4*x)" z \
        -function "sin(3*x)" r -function "sin(2*x)" g \
        -function "sin(x)" b -function "1+x" size \
        -set yt_position [4.0,1.1,0.3] -yt-scatter x y z size r g b \
        -yt-axis \
        -yt-ann -text 0.1 0.95 "yt-scatter example" \
        color=w,ha=left end \
        -yt-ann -text 0.1 0.9 "$ y=\sin(4 x);~z=\cos(4x) $" \
        color=w,ha=left end \
        -yt-text 3.5 "(-1.15)" "(-1.15)" "$ x $" "textcolor=[1,1,1,0.8]" \
        -yt-text "(-0.5)" 0.0 "(-1.2)" "$ y $" "textcolor=[1,1,1,0.8]" \
        -yt-text 0.0 "(-0.8)" 0.9 "$ z $" "textcolor=[1,1,1,0.8]" \
        -yt-source-list \
        -set yt_sigma_clip 0.5 -yt-render figures/yt_scatter.png